Check out our Chandler Neighborhood Stats
Chandler, Arizona Home Sales:
Click image below to enlarge!

2014
Although Chandler home sales had a big increase in December of 2013, 2014 started off worse than the previous two years, with only 228 Chandler home sales in January. This was a drop off of 79 fewer homes sold than in January of 2012. February through April Chandler home sales have steadily increased, and then there was another downturn in May. Chandler seasonal home sales typically increase or level off May through June, but this year, May saw a drop from April of 38 home sales, and is 71 less than in 2013. June and July have seen a typical seasonal slowdown in Chandler home sales, and home sales continue to remain lower than the previous two years. With home sales in Chandler declining, and inventory still very high, this could be a sign that the Chandler real estate market is moving towards a buyers market.
2013
In January of 2013, Chandler home sales started off a little lower than the previous year. Home sales in Chandler increased monthly through April, then remained fairly consistent April through July. Since August of 2013, home sales in Chandler have started decreasing, but due to the seasonality of real estate, it is pretty typical for the end of the year to see a drop-off in home sales (The graph has a sort-of bell curve as you can notice).
The gap between the number of homes sold in Chandler in 2012 compared to 2013, has been increasing ever since July. There were 43 more homes sold in July of 2013 than the previous year, but there were 84 fewer homes sold in November 2013 than in November of 2012, which could be a sign of a slowing housing market. However, Chandler home sales Year-To-Date (YTD) in 2013 ended up only down 295 compared to 2012, and predictions are that home sales will increase in December.
2012
Home sales in Chandler have remained rather consistent, other than the seasonal ups and downs as you can see by the graph above. In 2012, Chandler saw an increase in home sales throughout the first six months of the year. There was a drastic drop-off in July, and then it remained rather consistent throughout the end of the year. Typically, you would see home sales in Chandler decrease throughout the months of August through December.
Chandler Home Inventory: |
How inventory affects home prices:As you look at the graph to the left, you can see that the inventory of homes in Chandler, AZ has increased from a low of 365 in April of 2013 to a high of 1066 in June of 2014 (more than doubling). Seeing home values increase from 2012 throughout the first half of 2013, and having those home values remain steady over the last year has caused many more Chandler homeowners to list their home for sale. However, over the last couple of months, new listings of Chandler homes for sale has significantly decreased from a high of 580 in May, to 400 in July of 2014. With the average number of Chandler homes sold in the last 6 months being about 287, this leaves an absorption rate of around 3.25 months.
When the inventory of homes in Chandler increases, the economics of supply and demand will take effect. When there is a large inventory of homes available for sale in Chandler, home prices will decrease in value for a couple of reasons. One reason is because there are more homes for Chandler home buyers to choose from. Buyers will take their time in selecting a home, causing homes to stay on the market longer and increasing inventory. Because there are more Chandler homes for sale, home sellers will begin to lower their sales price in order to get their home sold. |
When the inventory of homes in Chandler decreases, you will start to see an increase in home prices. With a low inventory of homes, Chandler home sellers know that they can ask a higher price because there are more buyers in the market than homes for sale. Homes tend to sell faster, and for more money when inventory is low. There are fewer choices for Chandler home buyers, and sometimes you will have to offer a higher than list price to get the home you want.
Chandler Home Sales Prices:
Click image below to enlarge!
2014
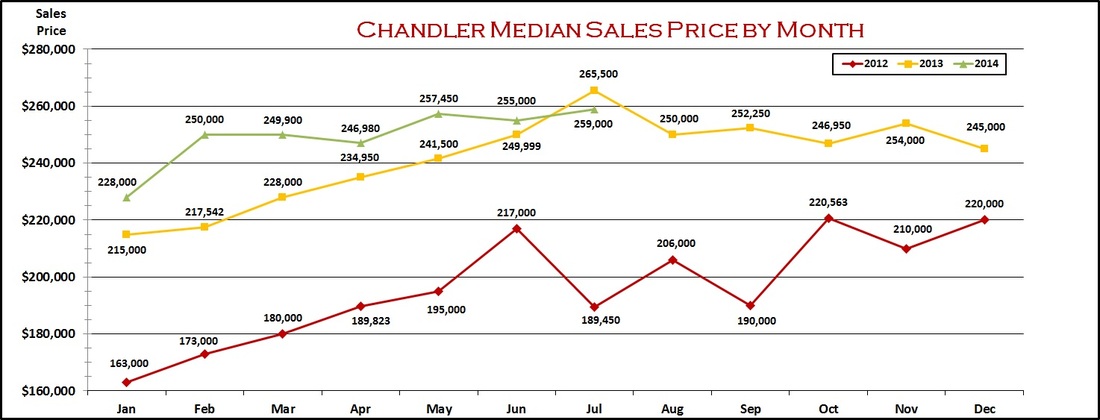
There was a drop in Chandler median home sales prices from December 2013 to January of 2014, but from February through July this year, Chandler median home prices have remained fairly consistent, and are around the same price they have been since June of 2013 (Fairly stable pricing for 12 months). The overall median price of Chandler homes remains steady, and because of this, many homeowners have decided to put their Chandler home on the market, which has increased the inventory of Chandler homes over the last year.
2012-2013
As you can see from the Chandler Median Home Sales Price graph above, median sales prices have increased from $163,000 in January of 2012, to a high of $265,500 in July of 2013. With the median sales price in Chandler at $254,000 in November of 2013, that reflects a 55.8% increase in Chandler median home prices in just under two years (a $91,000 increase). The increase in Chandler median sales prices over the last two years has helped many Chandler homeowners who may have been underwater on their home mortgage (owed more than the actual value of their home) since the housing market crash from 2007 through 2011.
Chandler Days On Market:
Click image below to enlarge!
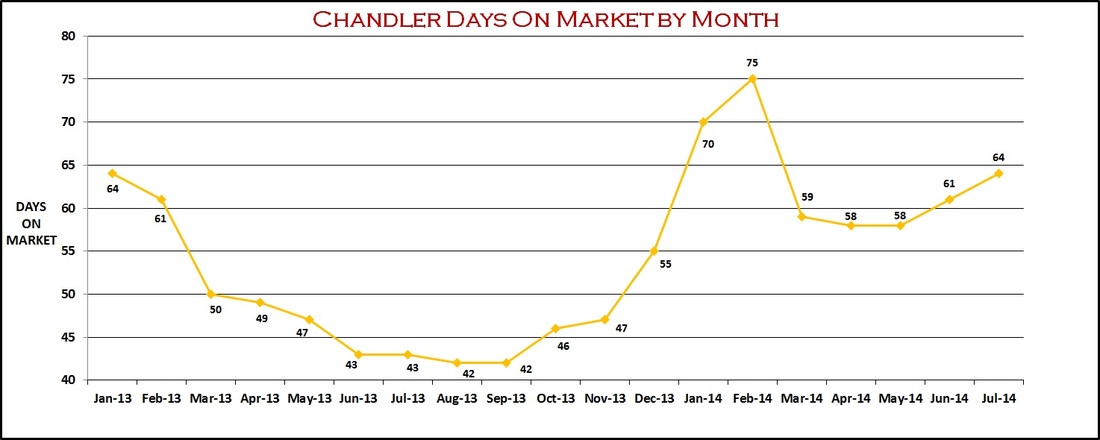
Days on market (DOM) is a measure of the age of a real estate listing. It is the total number of days a listing is on the active market before an offer is accepted on the property, or an agreement between the real estate broker and home seller ends. The higher the days on market, the longer it is taking for homeowners to sell their Chandler home. The lower the days on market, the faster a Chandler home is receiving a purchase contract, and getting off the market.
Generally, properties with a longer DOM will command lower prices than properties with a shorter DOM because a perception exists that the property may be overpriced or less desirable the longer it remains on the market. DOM often factors into developing a pricing strategy. DOM can also be used to gauge the condition, or trend of the housing market. Previous history has shown that a fairly stable real estate market in Chandler should have average days on the market somewhere between 60 and 90 days.
2014
From September 2013 to February 2014, the average days on market significantly increased from 42 days to 75 days, a 44.0% increase in less than 6 months; as the Chandler housing market slowed somewhat. The DOM in March took a large drop, and seems to have stabilized at just under 60 through May 2014. Over the months of June and July, days on market have been increasing. The increase in days on market may be signifying a slowing trend in Chandler home sales. I believe this trend should continue as long as sales prices remain steady, or slowly increase, and the Chandler home inventory remains high.
2013
As you can see by the graph above, 2013 started with 64 average days on the market for Chandler homes. Days on market decreased throughout the year until it reached a low of 42 days in August and September. During the summer months of June through August, the Chandler real estate market was selling homes at a faster rate, and for higher prices. By October of 2013, average days on market began to increase, home sales slowed down, and sales prices leveled off through the end of the year.
